Bangladesh-EU Trade and Economic Partnership

Report: Employment and working conditions in Bangladesh’s leather industry
Development Fine Prints
Mohammad Abdur Razzaque, PhD
Two Growth Stories and Trade Policy Choices
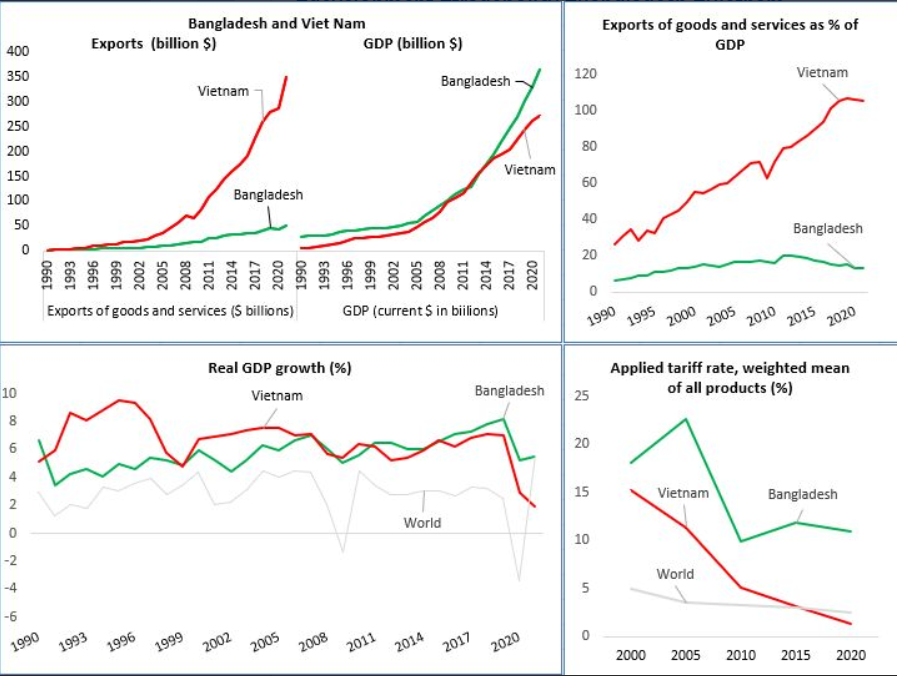
In 1990, exports from Viet Nam and Bangladesh were almost the same— around $1.7 billion. Since then, Viet Nam’s exports rocketed to $350 billion in 2021, and Bangladesh, which is regarded as an apparel export success story, saw its exports rise to just above $50 billion.Despite having a 7-times large export volume, Viet Nam’s economy, measured by GDP, is currently 33% lower than that of Bangladesh. Viet Nam’s ultra-export-led growth strategy has seen its export-GDP ratio rise from 25% in 1990 to more than 100% in 2021. The same ratio for Bangladesh, in contrast, peaked at 20% in 2011 and then declined to 13% in 2021.
In the early 1990s, while Bangladesh reduced its applied tariff rate from more than 70% to less than 20%, its import regime remains amongst the most protected ones in the developing world. In fact, Bangladesh is one of the very few countries to achieve and sustain high GDP growth with high protection for its import-competing sector. In 2020, the applied tariff rate in Bangladesh was close to 11% in comparison with only 1.34% in Viet Nam. Viet Nam’s GDP grew at a faster pace in the 1990s and 2000s, but Bangladesh outperformed Viet Nam in the 2010s.
These two nations stand out as classic contrasting examples of export-oriented and import-substituting industrialization, providing fascinating insights for trade policy choices.

Time to revisit the SDG targets and timeline?
Since the adoption of the Sustainable Development Goals (SDGs) in 2015, a series of global shocks have adversely affected growth and development prospects for developing countries.The first in the lot was the massive trade slowdown of 2015 and 2016; then the US-China trade war causing global trade to plunge; followed immediately by the Covid-19 global pandemic inflicting severe losses and damages to lives and livelihoods across the globe; then the Ukraine war leading to food and energy price hikes; and now a full-blown cost-of-living crisis with the IMF and others suggesting the world economies to experience a broad-based and sharper-than-expected slowdown, with inflation higher than seen in several decades.
Given all this, attaining the SDGs now looks more daunting than ever. It is perhaps high time to identify a more realistic and trimmed set of targets, from the originally prespecified list of 169, and make serious global efforts to achieve those. Extending the timeline can be another option.
It is also important to review the LDC graduation timelines for the countries that qualified to do so. The global economy is facing unprecedented crises, and merely setting up ambitious goals and targets will not serve the purpose.
Apparel Exports: A Tale of Two Countries in Two Markets
Over the past decade, China's share in EU imports of clothing items has fallen. Bangladesh has been able to capture much of China's lost share. China has lost its share in the US market as well, but Vietnam has been the main beneficiary. The duty-free market access that the EU grants to the least developed countries (LDCs) has helped Bangladesh. The US has never given such preference to Asian LDC exporters of apparel items. The striking contrast between EU and US markets bears important implications for Bangladesh's graduation from the group of LDCs (set to take place in 2026).
The demise of export-led growth
Following the success of the so-called Asian Tigers, many developing countries pursued an export-led growth strategy. Such a strategy will mean the share of exports in GDP to rise thereby propelling economic growth. The average export-GDP ratio for global economies steadily rose from 11% in 1970 to 31% in 2008. It then started retreating and fell to 26% in 2020.An overwhelming majority of Asian developing economies now experience a falling export-GDP ratio (Vietnam is notable among a few exceptions).
Some countries’ export orientation peaked at much higher levels than others. Malaysia reached 120% in 1999 before gradually declining to around 70% by the late 2010s.
Taiwan saw 80% in 2011 and Thailand 70% in 2008, and by the next decade, their export orientation would fall to around 60% and 50%, respectively. China peaked at 36%—considered a remarkably high level given its size—before witnessing a rapid fall to just half of that level by 2020.
India registered a maximum of 25% in 2013 before falling to 18% in 2020. Bangladesh peaked at 20% (in 2012), which then fell steadily to 13%.Pakistan’s highest export orientation was recorded just at 15% (in 2003) and was less than 10% in 2020.
These countries are now driven by domestic demand-led growth.However, the recent trend of a rapid fall in export orientation along with uncertainty in global trade and economic environments may have profound implications for trade policy choices.
Will countries now find protectionist policies more appealing than ever?

The Low-Hanging Fruit That Remains Elusive
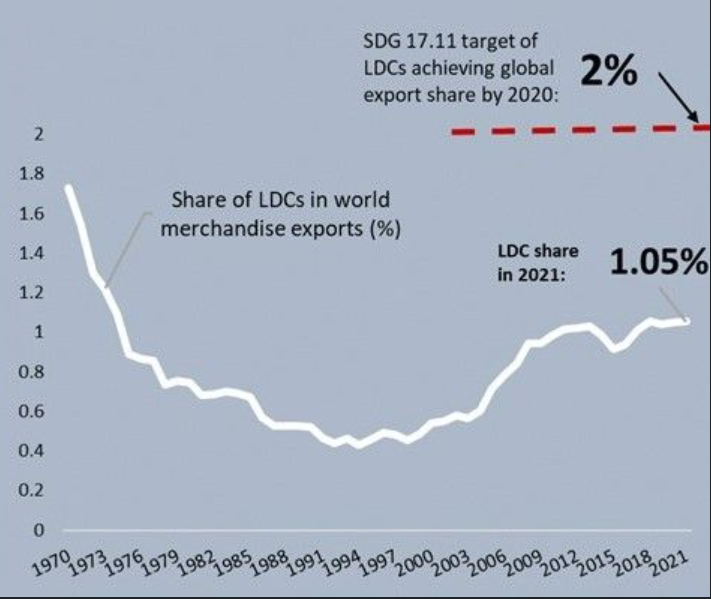
During the three decades of 1970—2000, the combined share of 48 UN-designated least developed countries (LDCs) in global merchandise exports fell from 1.72 per cent to just 0.45 per cent. Then the global community became upbeat about the revival of LDC trade performance as its global export share more than doubled to 1 per cent in 2011. Expectations were so high that one of the Sustainable Development Goals (SDGs) set a target of the LDC share of global exports doubling further to 2% by 2020 (yes, 2020 and not 2030 as the stipulated target date for most other indicators). Since the adoption of the SDGs in 2015, the relative significance of LDCs in global export trade has virtually stagnated at 1 per cent. Achieving a 2 per cent share even by 2030 now looks like a daunting prospect. But still, it is most appropriate to fix a new timeline for this target (SDGs 17.11.1).


